Why click events are different from other writes
When a user creates a link or updates a campaign, they’re waiting for a response. Those operations go straight to PostgreSQL. Click events are different: a visitor clicking a short link doesn’t wait for analytics — they’re redirected immediately. Recording the click is a background concern.
This creates a clear design opportunity: decouple the redirect path from the click-recording path entirely. The redirect handler should return in under 5 ms. Click recording can happen in the next few hundred milliseconds without anyone noticing.
But decoupling creates a durability question: if the click isn’t written synchronously, what guarantees it’s written at all?
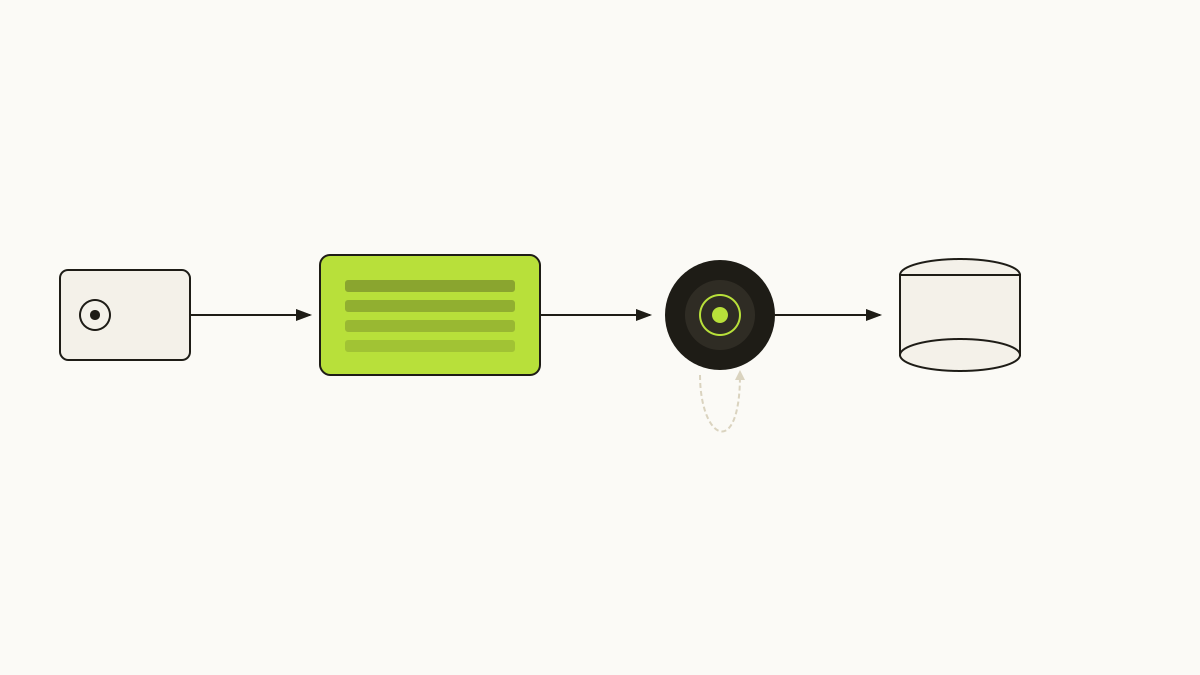
The architecture: Redis Streams as a durable buffer
We chose Redis Streams (introduced in Redis 5.0) as the event buffer between the redirect handler and the click consumer. Here’s why Streams beat a simple Redis list or pub/sub for this use case:
- Persistence: Streams are append-only logs. Entries survive Redis restarts (with AOF/RDB enabled).
- Consumer groups: Multiple consumer workers can read from a stream, and Redis tracks which entries have been acknowledged. Unacknowledged entries are redelivered on consumer restart.
- Backpressure: We can cap stream length with
MAXLEN ~to prevent unbounded memory growth under sustained load.
Producer side
The redirect handler appends a minimal event to the stream using XADD:
await redis.xadd(
    "clicks",
    {
        "link_id": str(link.id),
        "workspace_id": str(link.workspace_id),
        "ts": datetime.utcnow().isoformat(),
        "country": geo_result.country,
        "ua_family": ua_result.family,
        "referrer_domain": parsed_referrer.netloc,
    },
    maxlen=("~", 500_000),
)
Notice what’s not in this event: no raw IP address. We resolve IP to country in the redirect handler using a fast in-memory GeoLite2 lookup, then discard the IP. This is part of our PII minimization strategy — we never write raw IPs to any durable store.
Consumer side
A separate worker process reads from the stream using a consumer group:
async def consume_clicks(redis, db):
    while True:
        entries = await redis.xreadgroup(
            groupname="click-consumers",
            consumername=consumer_id,
            streams={"clicks": ">"},
            count=500,
            block=2000,
        )
        if not entries:
            continue
        events = parse_entries(entries)
        await bulk_insert_clicks(db, events)
        await redis.xack("clicks", "click-consumers",
                         *[e.id for e in events])
The critical detail: XACK only happens after the bulk insert succeeds. If the insert fails or the worker crashes between XREADGROUP and XACK, those entries remain in the Pending Entries List (PEL) and will be redelivered to another consumer on the next XAUTOCLAIM sweep.
Failure modes and how we handle them
Worker crash mid-batch
If the consumer crashes after reading 500 entries but before acknowledging them, those entries sit in the PEL. A separate health-check loop calls XAUTOCLAIM every 30 seconds to reclaim entries that have been pending for more than 60 seconds and reassign them to a healthy consumer.
Redis restart
With AOF persistence enabled (we use appendfsync everysec), the maximum data loss on an unclean Redis shutdown is approximately 1 second of events. For a click pipeline, losing 1 second of events in a crash scenario is acceptable — this isn’t a financial transaction system.
PostgreSQL write failure
If the bulk insert into PostgreSQL fails (connection loss, disk full, constraint violation), the consumer does not acknowledge the events. It logs the error, waits with exponential backoff, and retries. Constraint violations from duplicates are treated as successful — the event was already written.
Bulk inserts and batching strategy
Reading 500 events at a time and inserting them in a single INSERT ... VALUES (...) statement is dramatically more efficient than 500 individual inserts. At peak load we see:
- ~8,000 click events/second ingested into PostgreSQL
- ~16 bulk inserts/second at batch size 500
- PostgreSQL write latency: p99 under 40 ms per batch
Batching is the single biggest lever for write throughput. Without it, the click pipeline would saturate PostgreSQL at a fraction of this rate.
Observability
We expose two metrics from the click pipeline:
- Stream lag:
XLEN clicksminus the last-acknowledged offset, reported every 10 seconds. If this exceeds 100,000 we page. - PEL size: the number of unacknowledged entries in the Pending Entries List. A growing PEL indicates consumers are failing to acknowledge, which means something is wrong downstream.
Both metrics feed into our Prometheus scrape endpoint and appear on the internal ops dashboard.